In today's competitive business environment, making decisions based on assumptions can slow down growth and create missed opportunities. Businesses generate large amounts of sales data every day, including customer inquiries, leads, conversions, revenue, sales targets, and team performance. However, without the right tools, understanding this information and turning it into meaningful insights can be challenging.
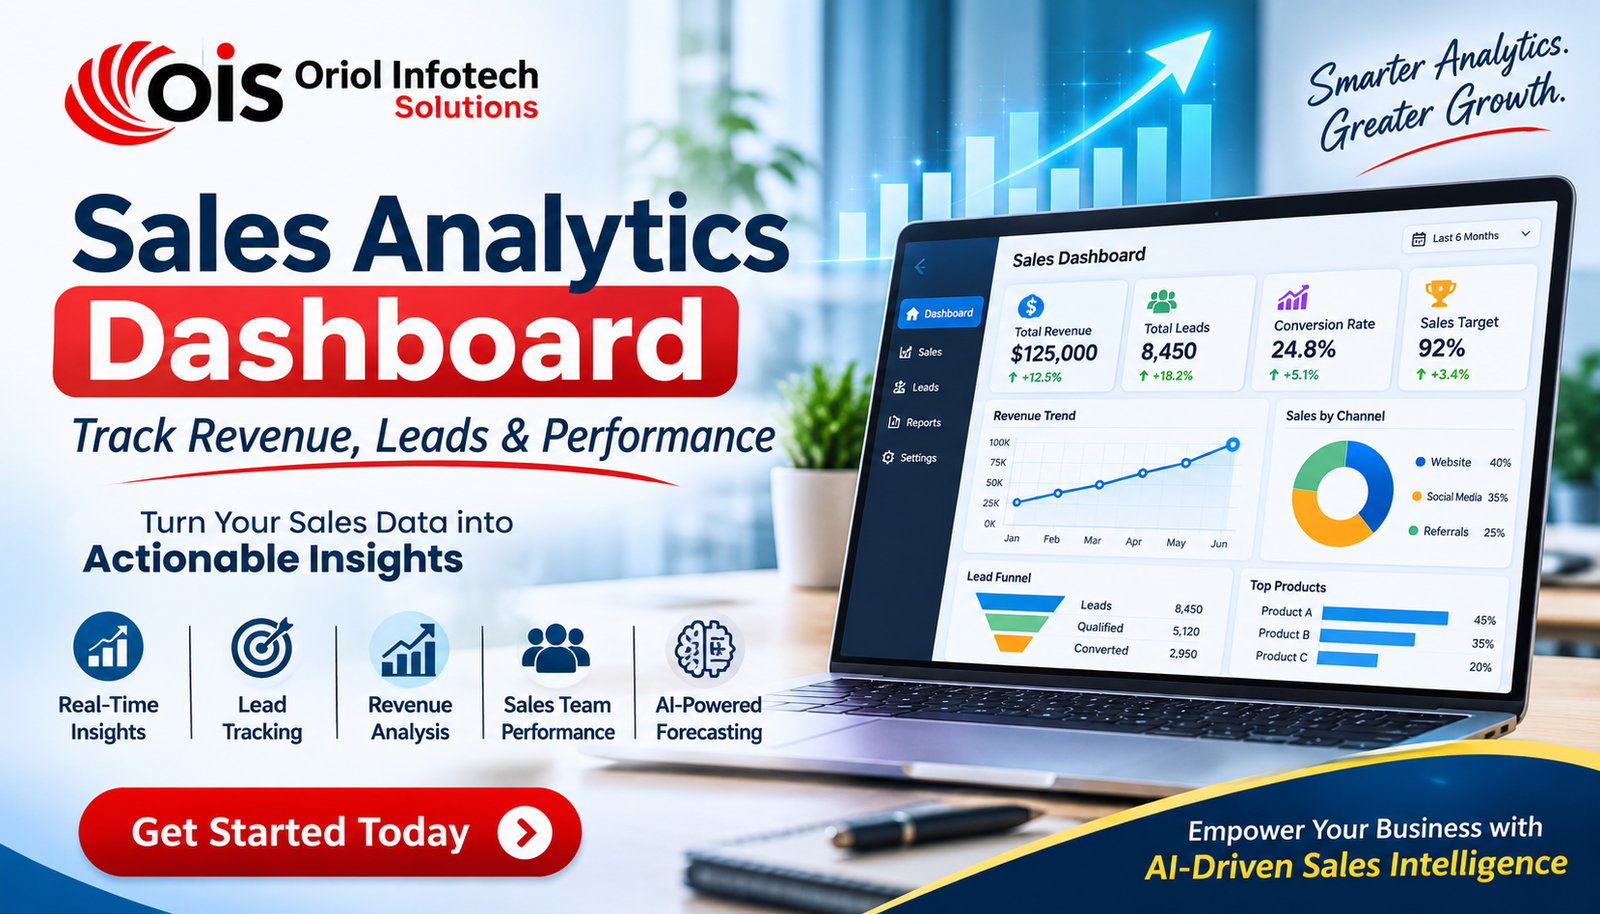
A Sales Analytics Dashboard helps businesses bring important sales information together in one centralized platform. It allows managers, business owners, and sales teams to monitor performance, track revenue, analyze leads, and identify areas that need improvement.
With the growing adoption of Artificial Intelligence (AI) and Business Intelligence (BI), modern sales dashboards are becoming more powerful. They do more than display numbers. They can help identify trends, highlight performance gaps, automate reports, and support more informed business decisions.
In this guide, we will explore what a sales analytics dashboard is, its essential features, benefits, key performance indicators, and how businesses can use AI-powered analytics to improve sales performance.
What Is a Sales Analytics Dashboard?
A Sales Analytics Dashboard is a centralized reporting and data visualization tool that collects, organizes, and displays sales-related information in an easy-to-understand format.
It helps businesses monitor important metrics such as total revenue, lead generation, conversion rates, sales targets, customer acquisition, and individual sales performance.
Instead of checking multiple spreadsheets, CRM platforms, and reports, users can access relevant sales information from a single dashboard.
For example, a sales manager can use a Sales Performance Dashboard to understand:
How much revenue the business generated during a specific period.
How many leads entered the sales pipeline.
Which marketing channels generated the most qualified leads.
How many leads converted into paying customers.
Which products or services generate the highest revenue.
Whether the sales team is achieving its targets.
An advanced AI-powered sales dashboard can also analyze historical information, identify unusual changes, and provide predictive insights to support future planning.
Why Does Every Growing Business Need a Sales Dashboard?
As a business expands, its sales operations become more complex. More customers, employees, products, marketing channels, and transactions create additional data that must be monitored.
Managing this information manually can lead to reporting delays, inconsistent figures, and missed opportunities.
A business sales dashboard helps solve these challenges by providing a clear overview of sales activities and business performance.
1. Monitor Sales Performance in Real Time
Sales performance can change throughout the day. A real-time dashboard allows authorized users to monitor available sales data without waiting for manually prepared reports.
Businesses can track daily revenue, new leads, pending deals, completed transactions, and target achievement.
This visibility helps managers identify issues earlier and respond with appropriate actions.
2. Improve Lead Management
Generating leads is only one part of the sales process. Businesses must also understand lead quality, follow-up activity, and conversion performance.
A Lead Tracking Dashboard helps monitor leads from their initial inquiry to final conversion.
It can display lead sources, assigned sales representatives, follow-up status, pipeline stages, and conversion outcomes.
This makes it easier to identify where potential customers are getting stuck and where additional attention is required.
3. Understand Revenue Performance
Revenue tracking is essential for evaluating business growth.
A Revenue Tracking Dashboard can display revenue by month, quarter, product, service, customer segment, or sales representative.
Managers can compare actual revenue with targets, analyze historical performance, and identify the products or services contributing most to business income.
4. Make Data-Driven Decisions
A centralized Sales Analytics Dashboard gives decision-makers access to relevant information instead of relying only on assumptions.
For example, if a marketing channel generates many inquiries but very few conversions, management can investigate lead quality, targeting, or the sales follow-up process.
Data-driven decisions help businesses allocate resources more effectively.
Essential Features of a Sales Analytics Dashboard
An effective dashboard should provide useful information in a simple, organized, and accessible format. The features required will depend on the company's sales process and reporting objectives.
Here are some important features to consider.
1. Revenue Tracking and Analysis
Revenue tracking is one of the most important functions of a sales dashboard.
It should provide information about:
Total sales revenue.
Daily, weekly, and monthly revenue.
Revenue by product or service.
Revenue by customer or region.
Actual revenue versus sales targets.
Historical revenue comparisons.
These insights help businesses understand their financial performance and identify revenue opportunities.
2. Lead Generation and Conversion Tracking
A Lead Tracking Dashboard helps businesses understand how leads move through the sales funnel.
Important information includes:
Total leads generated.
New and active leads.
Lead source and campaign.
Qualified and unqualified leads.
Follow-up status.
Converted and lost leads.
Lead-to-customer conversion rate.
Tracking these metrics helps sales managers identify bottlenecks and improve lead management strategies.
3. Sales Team Performance Monitoring
Sales teams directly influence revenue generation. A Sales Performance Dashboard makes it easier to evaluate individual and team performance.
It may include:
Managers can use this information to identify training requirements, recognize high-performing employees, and improve sales processes.
4. Interactive Charts and Data Visualization
Raw data can be difficult to interpret, particularly when businesses work with thousands of records.
Sales Data Visualization converts complex information into charts, graphs, tables, and visual summaries.
Common visualizations include:
Revenue trend charts.
Lead conversion funnels.
Sales target progress charts.
Product performance comparisons.
Monthly sales reports.
Regional sales comparisons.
Interactive filters and drill-down reports allow users to explore specific periods, teams, products, or locations.
5. Automated Sales Reporting
Preparing reports manually can consume valuable time.
An Automated Sales Reporting System can generate scheduled reports, display updated dashboard information, and distribute summaries to authorized users.
Depending on the implementation, reports may be exported in formats such as PDF and Excel or shared through email.
Automation reduces repetitive reporting work and helps management access information more consistently.
How AI Is Transforming Sales Analytics Dashboards
Traditional dashboards primarily display historical and current business information. Modern AI-powered sales analytics can go further by analyzing patterns and supporting predictive decision-making.
Artificial Intelligence and Machine Learning can help businesses discover insights that may be difficult to identify through manual reporting.
1. AI-Powered Sales Forecasting
Sales Forecasting helps businesses estimate future revenue using historical sales data, current pipeline information, and relevant business patterns.
AI models can analyze previous performance and available sales indicators to generate forecasts.
These insights can support:
Forecasts are estimates, not guarantees. Their reliability depends on data quality, model design, and changing market conditions.
2. Intelligent Lead Scoring
Not every lead has the same likelihood of becoming a customer.
AI Lead Scoring can evaluate available information, such as customer interactions, inquiry history, engagement, and previous conversion patterns, to help prioritize leads.
Sales teams can use these scores to decide which opportunities may require faster follow-up.
3. Sales Trend and Pattern Analysis
AI can analyze historical sales information to identify recurring patterns, changes in demand, and performance variations.
For example, businesses may discover that certain products perform better during specific periods or that a particular customer segment generates higher average revenue.
These findings can support more informed sales and marketing strategies.
4. Automated Insights and Smart Alerts
Advanced AI Business Intelligence Dashboards can generate summaries and alerts based on defined business rules or detected patterns.
Examples include:
Revenue falling below a selected target.
A sudden decline in lead conversions.
An increase in pending sales opportunities.
Unusual changes in sales performance.
Significant differences between actual and expected results.
Such alerts help managers focus on issues that may need attention.
Benefits of Using a Custom Sales Analytics Dashboard
Every business has different sales processes, reporting requirements, and performance goals. A standard reporting template may not provide all the information a company needs.
A Custom Sales Analytics Dashboard can be designed around specific business requirements.
Some major benefits include:
1. Centralized Sales Information
A custom dashboard can bring information from different business systems into one reporting environment.
This reduces the need to switch between multiple platforms to understand overall performance.
2. Better Sales Visibility
Managers can view important sales metrics through a centralized interface, helping them understand current performance and identify areas requiring improvement.
3. Reduced Manual Reporting
Automated data processing and report generation can reduce repetitive spreadsheet work and improve reporting efficiency.
4. Improved Team Accountability
Role-based dashboards can give employees and managers access to relevant performance information.
Sales representatives can monitor their targets, while management can review team-level results.
5. Scalable Business Intelligence
As a company grows, its reporting requirements may change. A custom Business Intelligence Dashboard can be expanded with additional KPIs, data sources, departments, and reporting features.
How to Build an Effective Sales Analytics Dashboard
Building a useful dashboard requires more than adding charts to a screen. It involves understanding business objectives, selecting the right data sources, and designing reports that support actual decisions.
Here is a practical development process.
Step 1: Identify Business Goals
Start by understanding what the organization wants to measure.
Some businesses prioritize revenue growth, while others focus on lead conversion, customer retention, or sales team productivity.
The dashboard should reflect these objectives.
Step 2: Select the Right KPIs
Choose metrics that directly relate to business goals.
Avoid displaying too many numbers that do not contribute to decision-making. A focused dashboard is generally easier to understand and use.
Step 3: Connect Business Data Sources
Sales information may be stored across CRM systems, ERP platforms, accounting software, websites, mobile applications, and databases.
Data integration helps bring relevant information together.
Step 4: Design the Dashboard Interface
Organize information into meaningful sections, such as revenue, leads, conversions, targets, and employee performance.
Use interactive charts, filters, and drill-down reports to make information easier to explore.
Step 5: Implement Analytics and Automation
Add automated reporting, data processing, alerts, and AI-powered analysis where they provide practical value.
Step 6: Test Accuracy and Security
Validate calculations, data synchronization, access permissions, and reporting accuracy before deployment.
Step 7: Monitor and Improve
Review dashboard usage and business requirements regularly. Update KPIs, reports, and integrations as the organization evolves.
Why Data Integration Matters for Sales Analytics
A sales dashboard is only as useful as the information it receives.
Businesses often maintain sales-related data in different systems. For example, customer inquiries may be stored in a CRM, transactions in accounting software, and website leads in an online database.
Without proper integration, information may remain disconnected.
Data Integration helps combine relevant information from multiple sources into a consistent reporting environment.
A custom dashboard may integrate with:
CRM and sales management systems.
ERP platforms.
Accounting and finance software.
E-commerce websites.
Marketing and advertising platforms.
Mobile applications.
Third-party APIs and databases.
ETL (Extract, Transform, Load) processes can help collect, clean, transform, and prepare information for reporting.
This creates a more consistent foundation for Business Intelligence and Sales Analytics.
Industries That Can Benefit from Sales Analytics Dashboards
Sales analytics is useful across different industries because most organizations need to monitor revenue, customer acquisition, and business performance.
Examples include:
Retail and E-commerce: Track product sales, order value, customer segments, and revenue trends.
Real Estate: Monitor property inquiries, lead sources, site visits, bookings, and deal closures.
Healthcare: Analyze service inquiries, appointment bookings, and revenue from different services while maintaining appropriate data privacy.
Manufacturing: Monitor product sales, distributor performance, demand trends, and regional revenue.
Education and Training: Track course inquiries, admissions leads, enrollment conversions, and campaign performance.
Finance and Professional Services: Monitor client acquisition, service revenue, pipeline activity, and business targets.
A customized dashboard can help each industry focus on the metrics most relevant to its operations.
Why Choose Oriol Infotech Solutions for AI Dashboards and Business Intelligence?
Choosing the right technology partner is important when developing a dashboard that supports business-critical decisions.
Oriol Infotech Solutions provides custom AI Dashboards and Business Intelligence Solutions designed to turn business data into actionable insights.
Its dashboard and BI services cover key capabilities such as:
Custom dashboard development for business performance and sales analytics.
Real-time data visualization with interactive charts and reports.
KPI and performance tracking.
Predictive analytics and forecasting.
AI-generated insights, summaries, and recommendations.
Data integration with ERP, CRM, websites, applications, and databases.
Automated reporting and scheduled dashboards.
Secure access controls and scalable architecture.
Rather than relying only on generic reporting templates, businesses can explore dashboard solutions aligned with their workflows, data sources, and reporting requirements.
Whether you need a Sales Analytics Dashboard, a management reporting system, or a broader AI-powered Business Intelligence Platform, Oriol Infotech Solutions can help you plan a solution around your business objectives.
Explore the service: https://oriolinfotech.com/ai-dashboards-and-business-intelligence
Frequently Asked Questions (FAQs)
1. What is a sales analytics dashboard?
A Sales Analytics Dashboard is a reporting platform that displays important sales metrics, including revenue, leads, conversions, sales targets, and team performance. It helps businesses monitor results and make informed decisions using centralized data.
2. What should a sales dashboard include?
A useful sales dashboard should include total revenue, lead generation, conversion rates, sales pipeline status, average deal value, sales targets, and team performance. Additional KPIs can be added based on business requirements.
3. How does AI improve sales analytics?
AI improves sales analytics by identifying patterns, supporting sales forecasting, prioritizing leads, detecting unusual changes, and generating automated insights. It helps businesses interpret data and make more informed decisions.
4. Can a sales dashboard integrate with CRM and ERP software?
Yes. A custom Sales Dashboard can integrate with CRM, ERP, accounting platforms, websites, databases, and third-party APIs. Integration helps consolidate sales information into one reporting environment.
5. What is the difference between a sales dashboard and a CRM?
A CRM system primarily manages customer information, interactions, leads, and sales activities. A Sales Analytics Dashboard focuses on visualizing and analyzing sales performance. A dashboard can use CRM data to provide additional reporting and insights.
6. Can small businesses use sales analytics dashboards?
Yes. Small businesses can use dashboards to track leads, revenue, customer acquisition, and sales targets. A solution can start with essential metrics and expand as the business grows.
7. How does a sales dashboard help increase revenue?
A sales dashboard does not directly generate revenue, but it helps businesses identify conversion gaps, monitor sales opportunities, understand revenue trends, and improve resource allocation. These insights can support better sales strategies.
8. What is an AI-powered Business Intelligence Dashboard?
An AI-powered Business Intelligence Dashboard combines data visualization with AI and analytics capabilities. It can help identify trends, generate insights, support forecasting, and automate selected reporting tasks.
Conclusion
A Sales Analytics Dashboard is an important tool for businesses that want better visibility into revenue, lead generation, conversions, and team performance.
By bringing sales information together in one centralized platform, organizations can reduce manual reporting, identify performance gaps, and make more informed business decisions.
With the addition of Artificial Intelligence, Predictive Analytics, and Business Intelligence, modern dashboards can provide more than historical reports. They can help businesses understand patterns, anticipate possible outcomes, and identify opportunities for improvement.
For organizations looking to improve their reporting capabilities, a custom dashboard can provide a practical foundation for smarter business management.
Oriol Infotech Solutions helps businesses transform their data into meaningful insights through custom AI Dashboards and Business Intelligence Solutions.
Ready to track your sales performance more effectively?
Contact Oriol Infotech Solutions today to discuss a custom sales analytics dashboard for your business.